
Finance automation dashboards for the UNSW CFO
ROI, payback and bot health in Power BI, presented to the CFO
Role: Designed and built the Power BI dashboards (Data Analyst Intern)
- Power BI
- UiPath
- Microsoft Excel
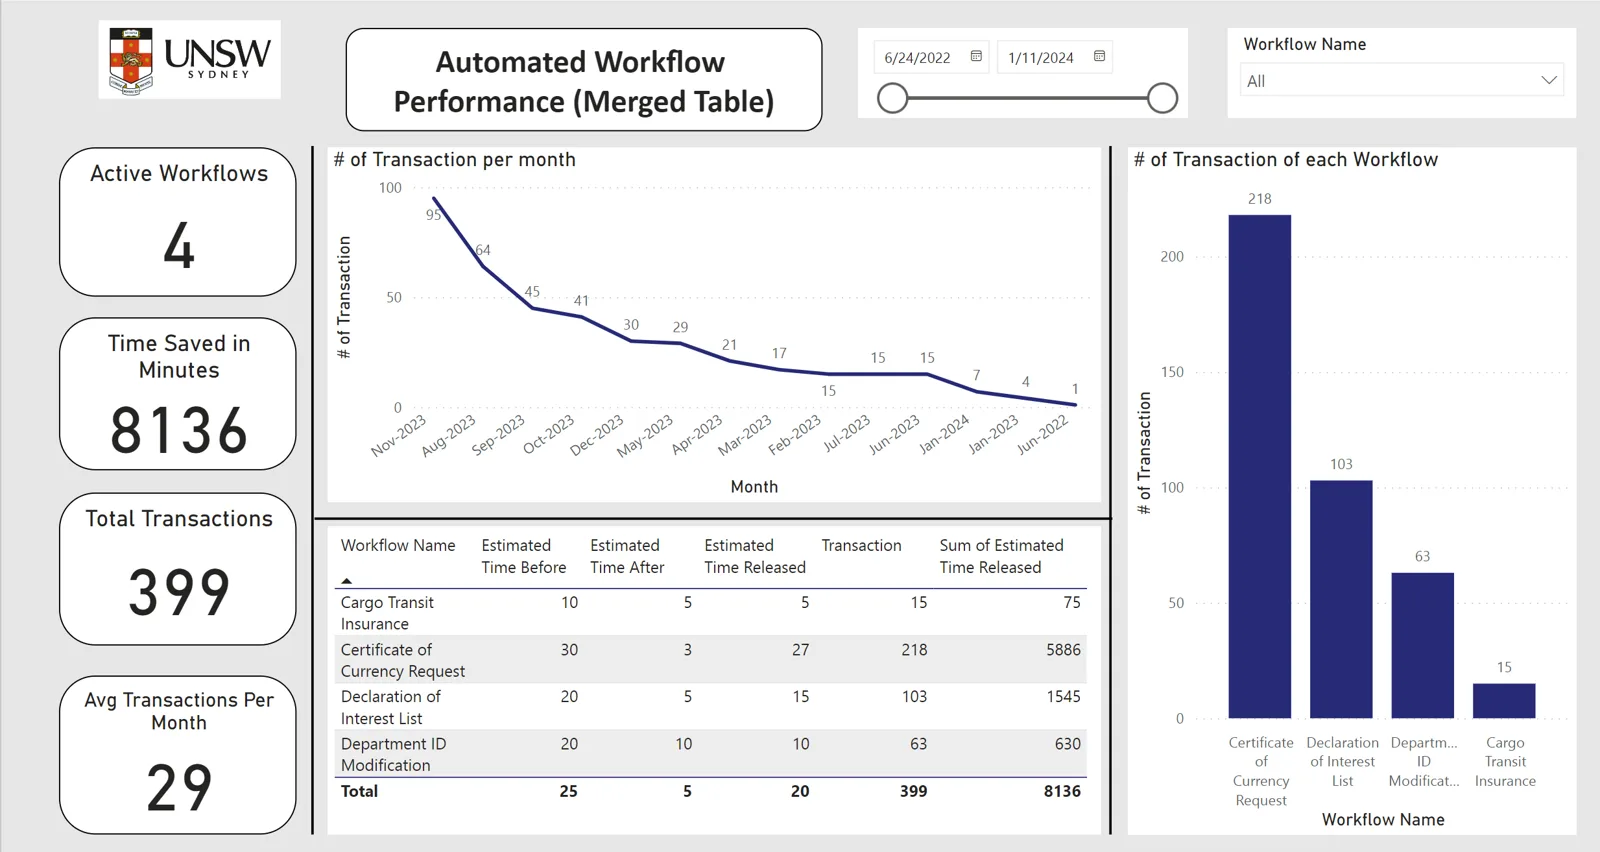
Dashboard figures
- 4active automated workflows
- 8,136estimated minutes saved
- 399transactions
- Jun 2022 to Jan 2024date range
From the Automated Workflow Performance report. Time saved is an estimate: estimated minutes before minus after automation, times the transaction count.
Before vs after
Before
The CFO question
- Which automation projects pay off?
- Why do some bot runs fail?
- Insight scattered across reports
After
The dashboards
8,136estimated minutes saved
- ROI and payback period per project
- Bot success, failure and exception reasons
- 8,136 estimated minutes saved, in one view
Continuous Improvement Dashboard
01Step 1 of 4, Microsoft Excel
Project register
Each automation project: cost, saving, category, customer, owner.
02Step 2 of 4, Power BI
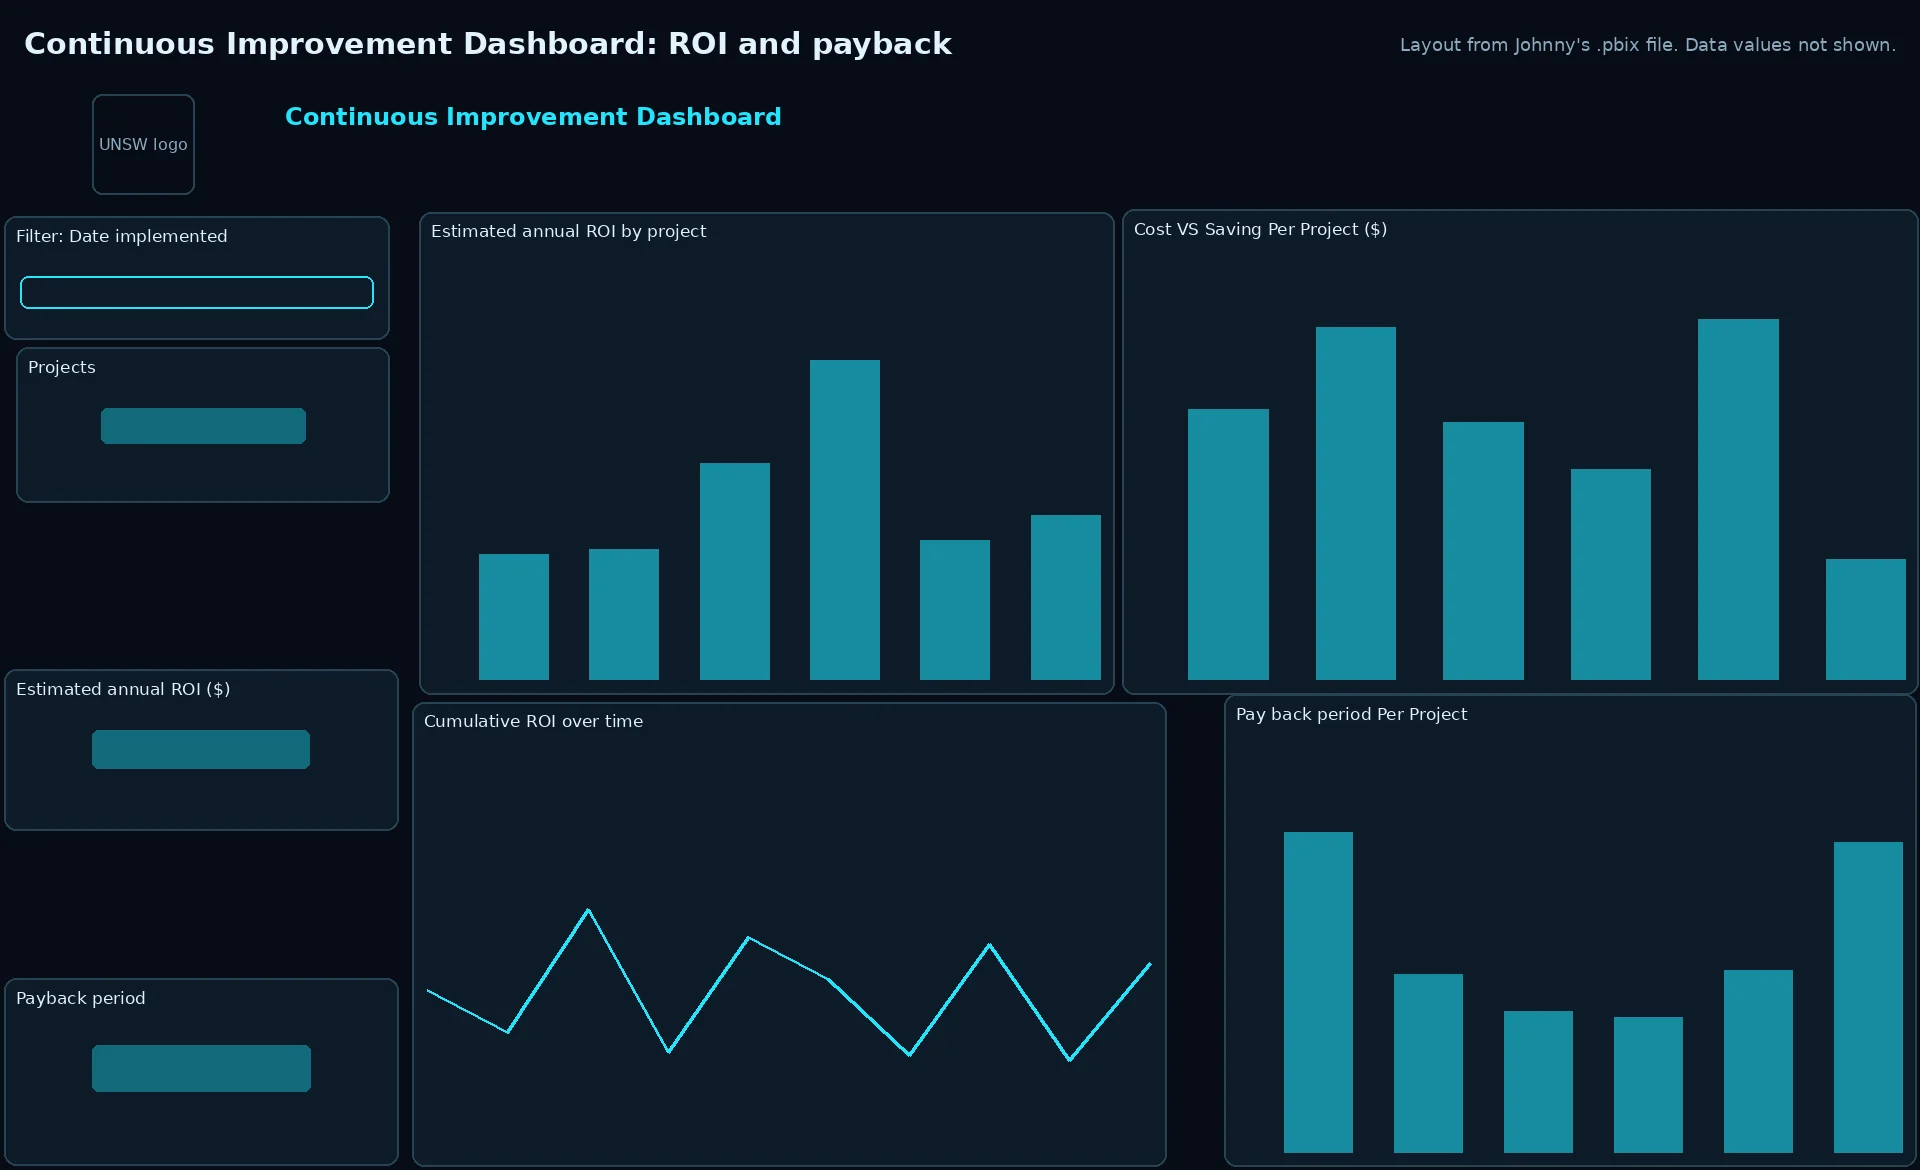
ROI and payback model
ROI = saving minus cost. Payback in weeks = cost / weekly saving.
03Step 3 of 4, Power BI
ROI by project
Estimated annual ROI, cost vs saving, cumulative ROI, payback per project.
04Step 4 of 4, Power BI
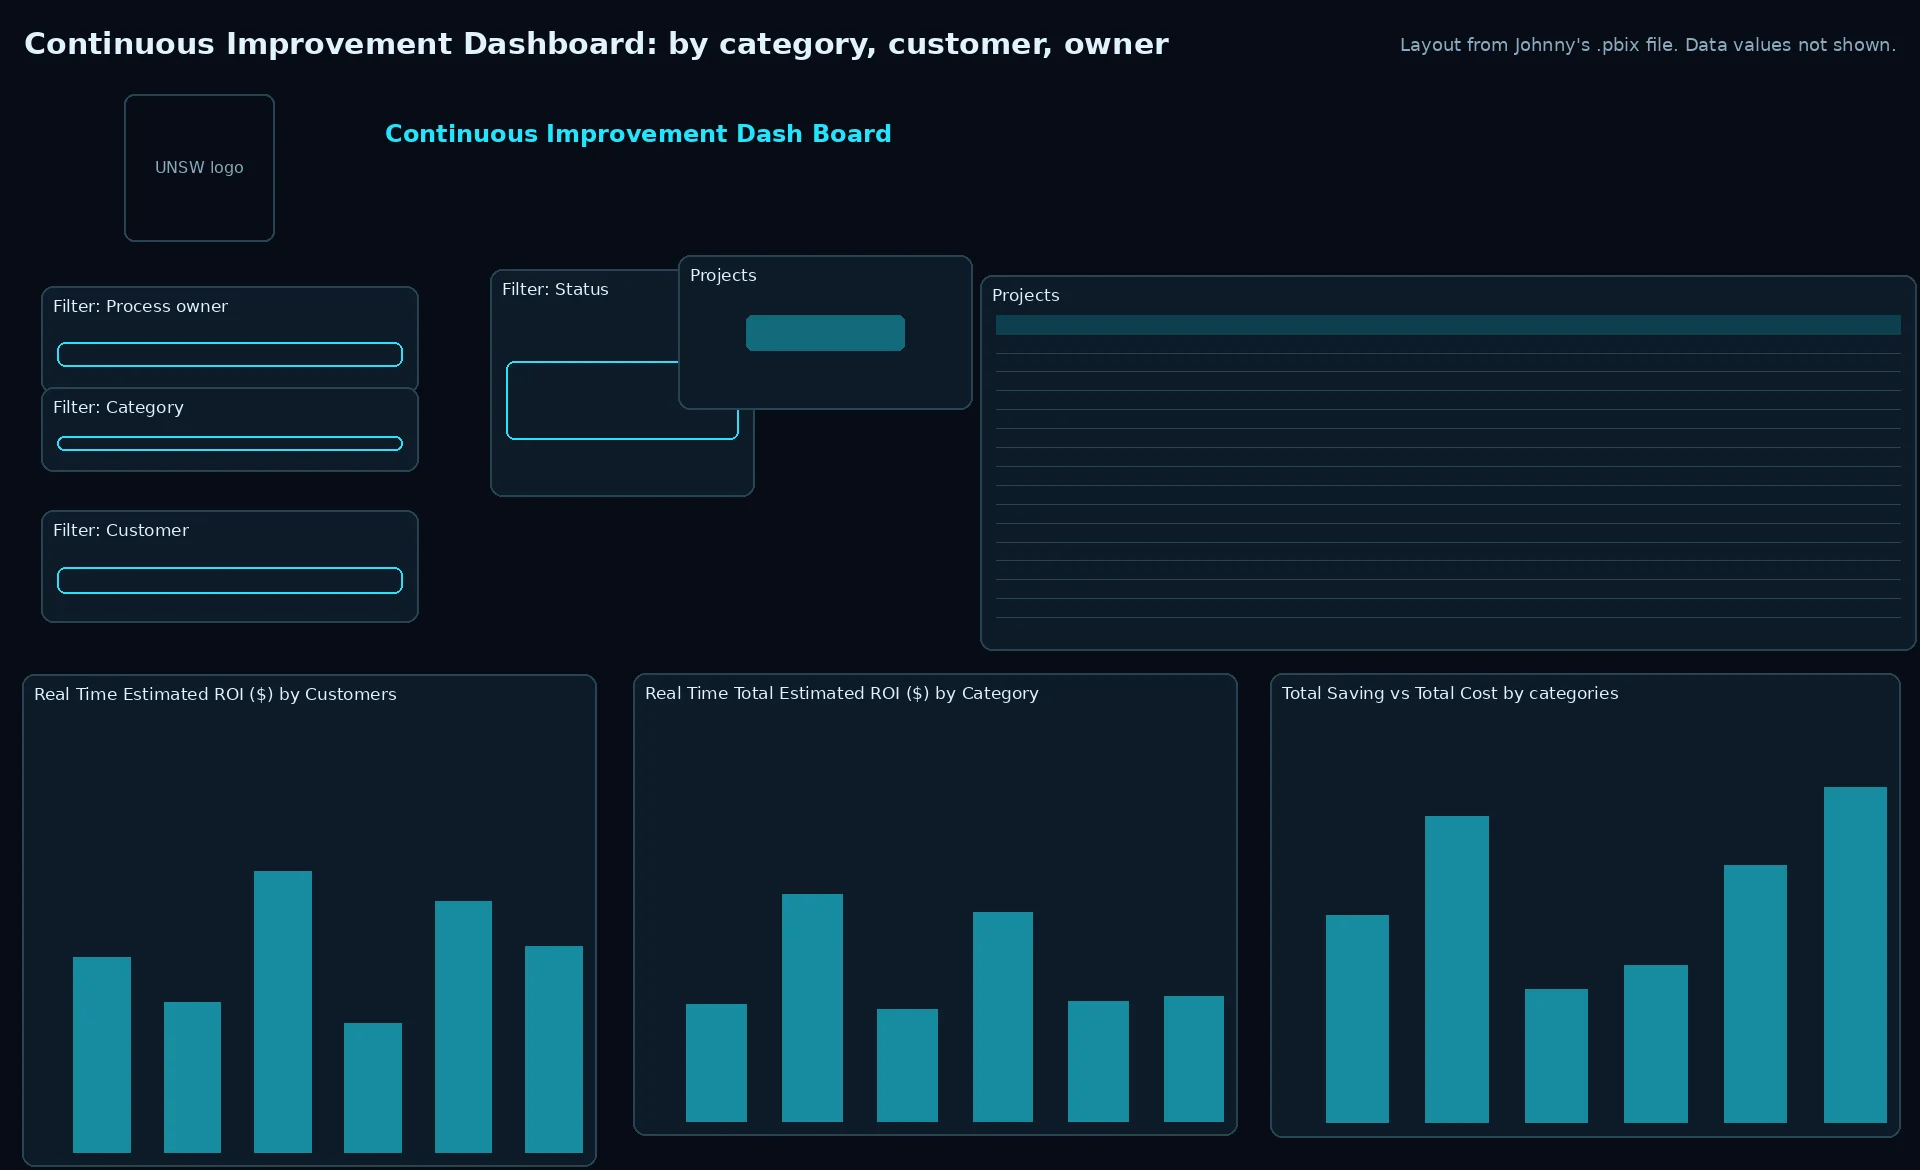
Slice and present
Filter by category, customer and process owner. Presented to the CFO.
Automation dashboard redesign
01Step 1 of 3, Power BI
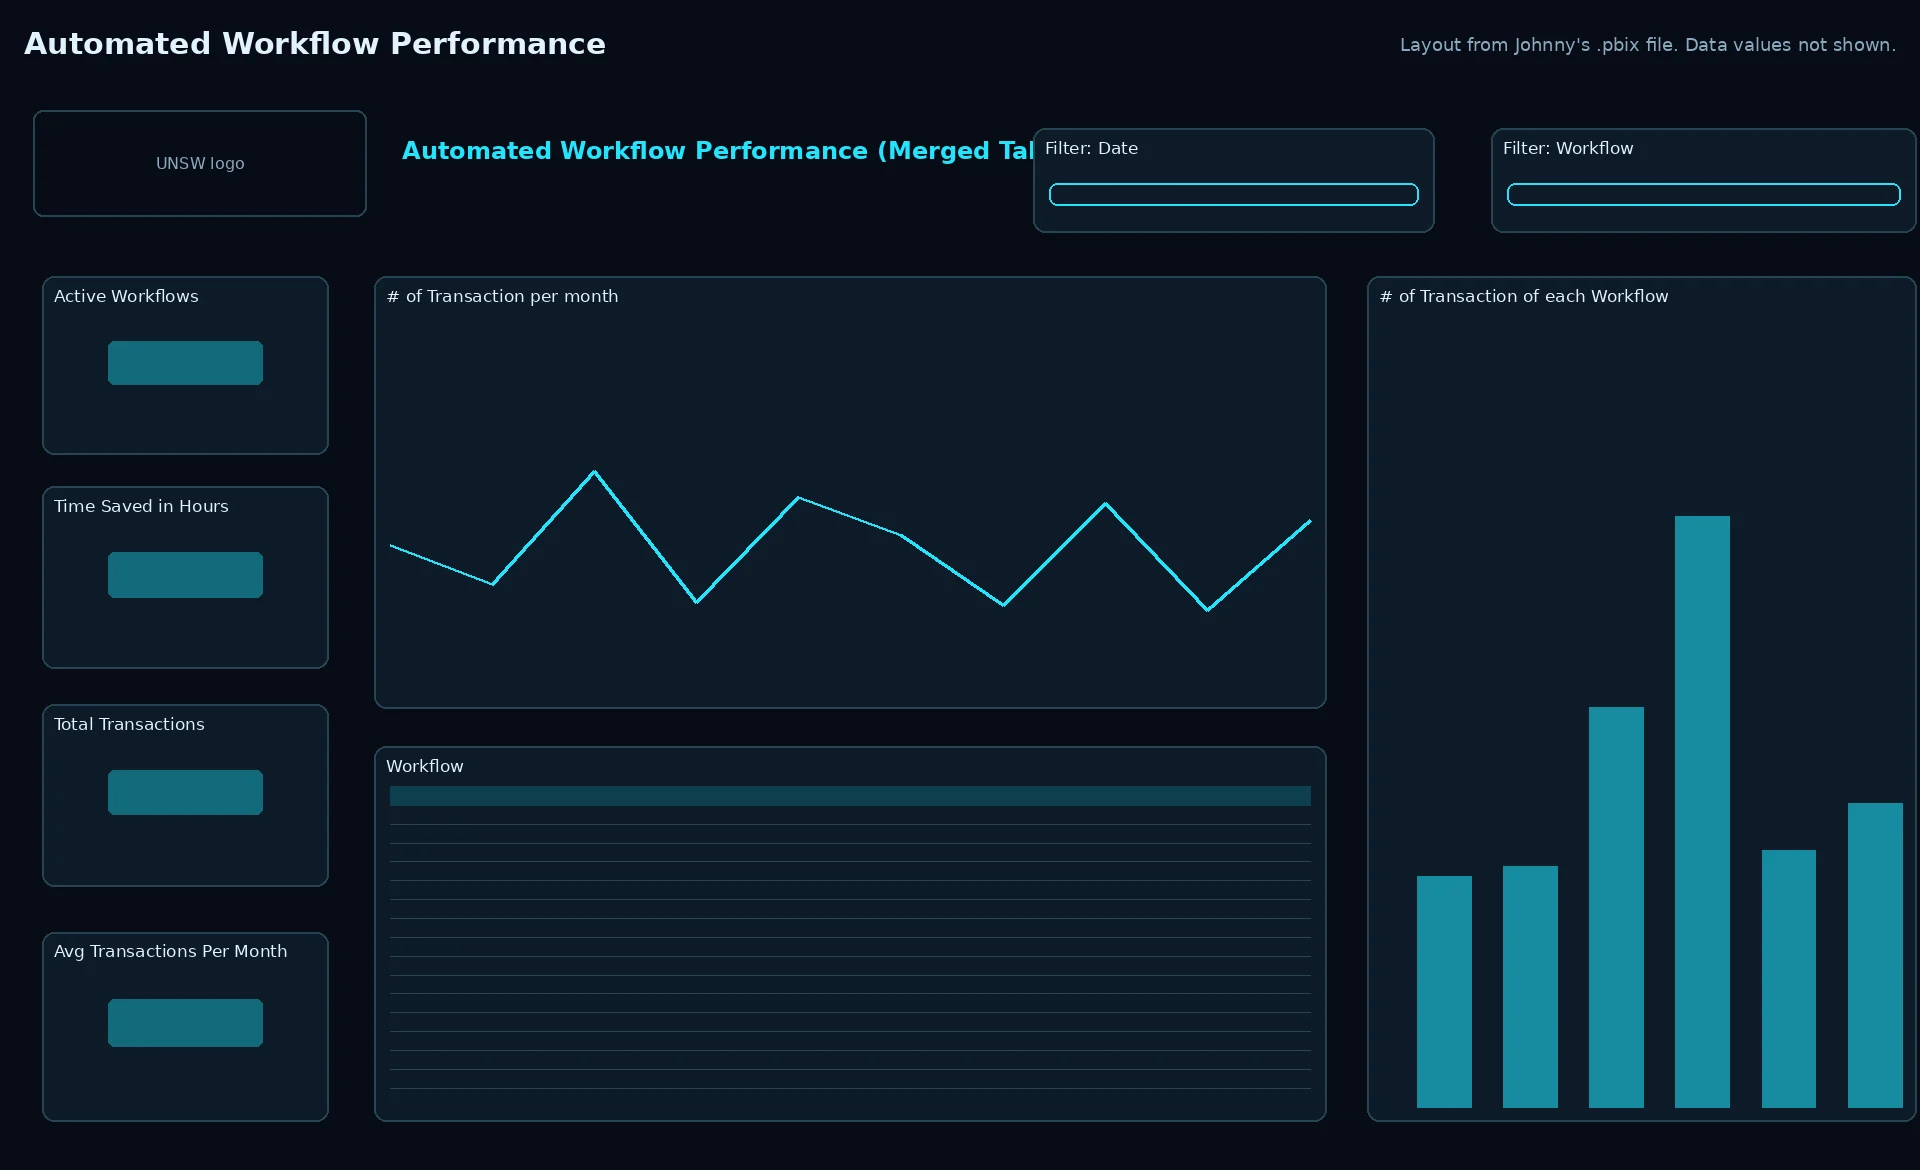
Workflow performance
Active workflows, transactions per month, estimated time saved.
02Step 2 of 3, UiPath
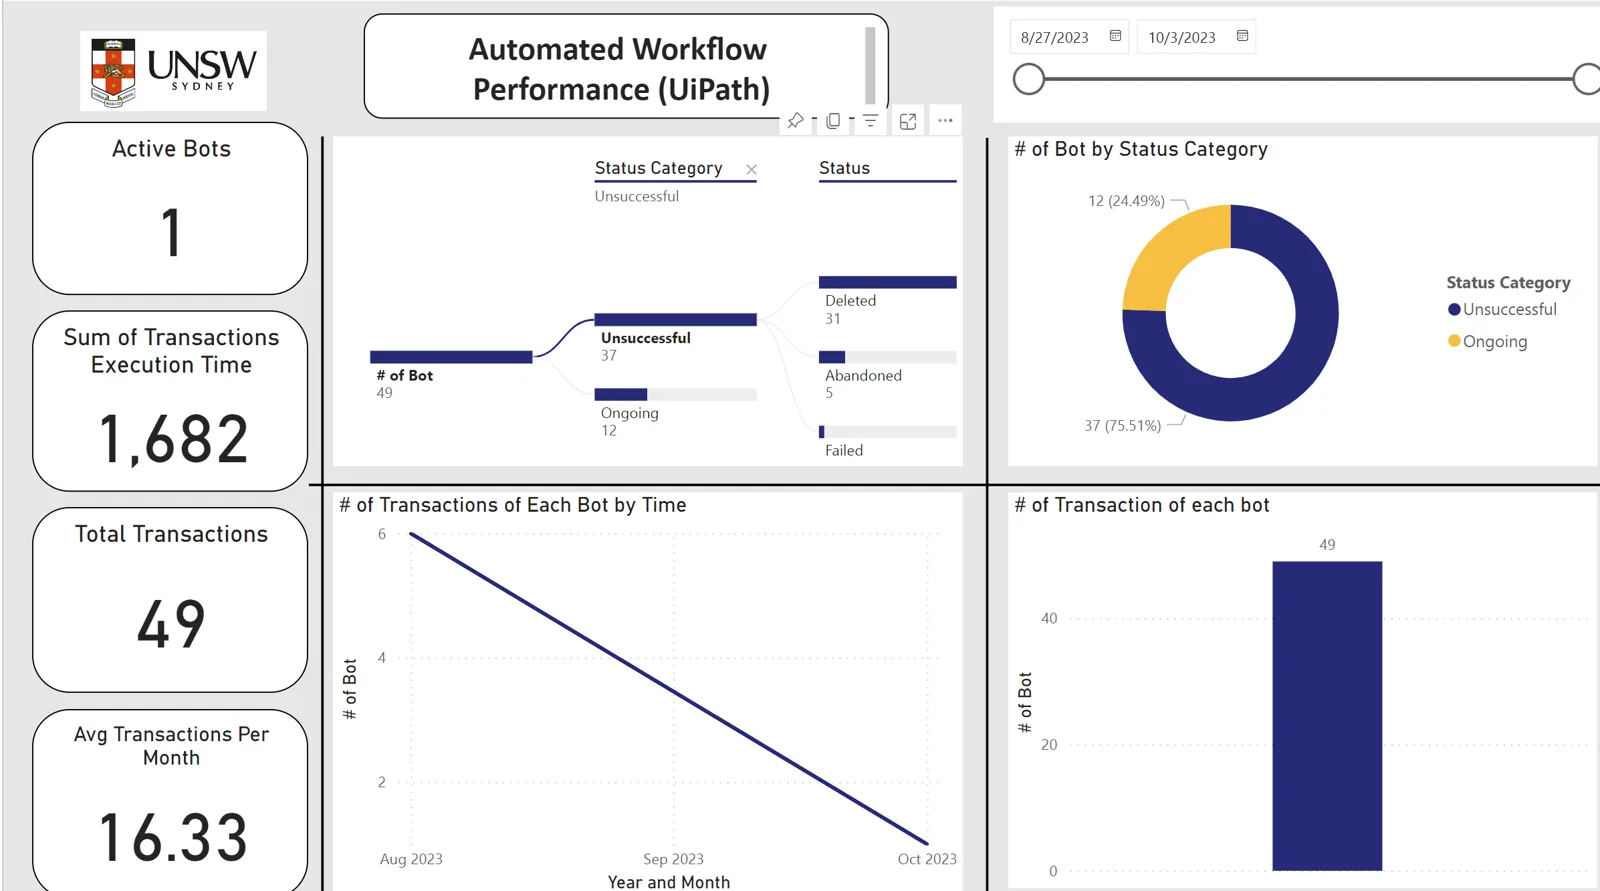
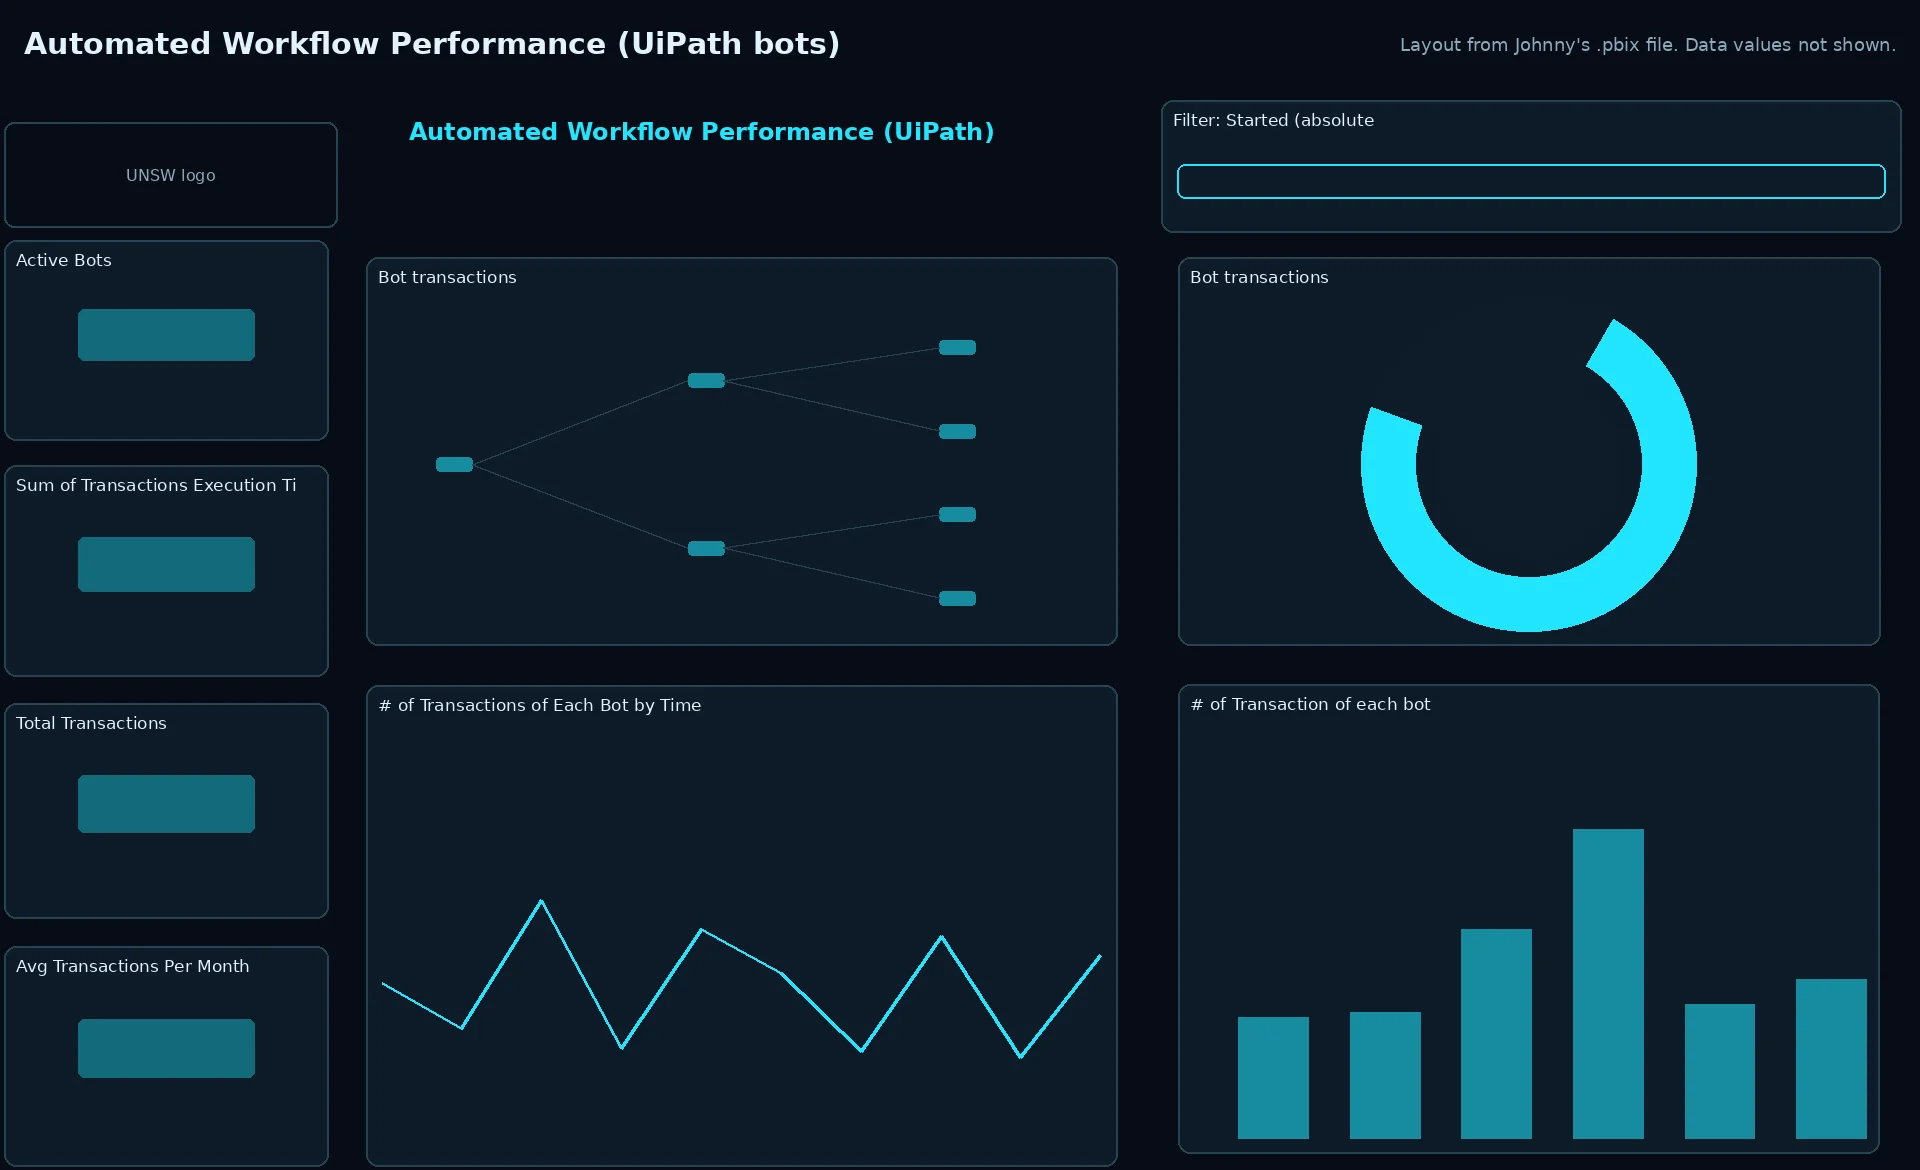
Bot health
UiPath bot runs by status category over time.
03Step 3 of 3, Power BI
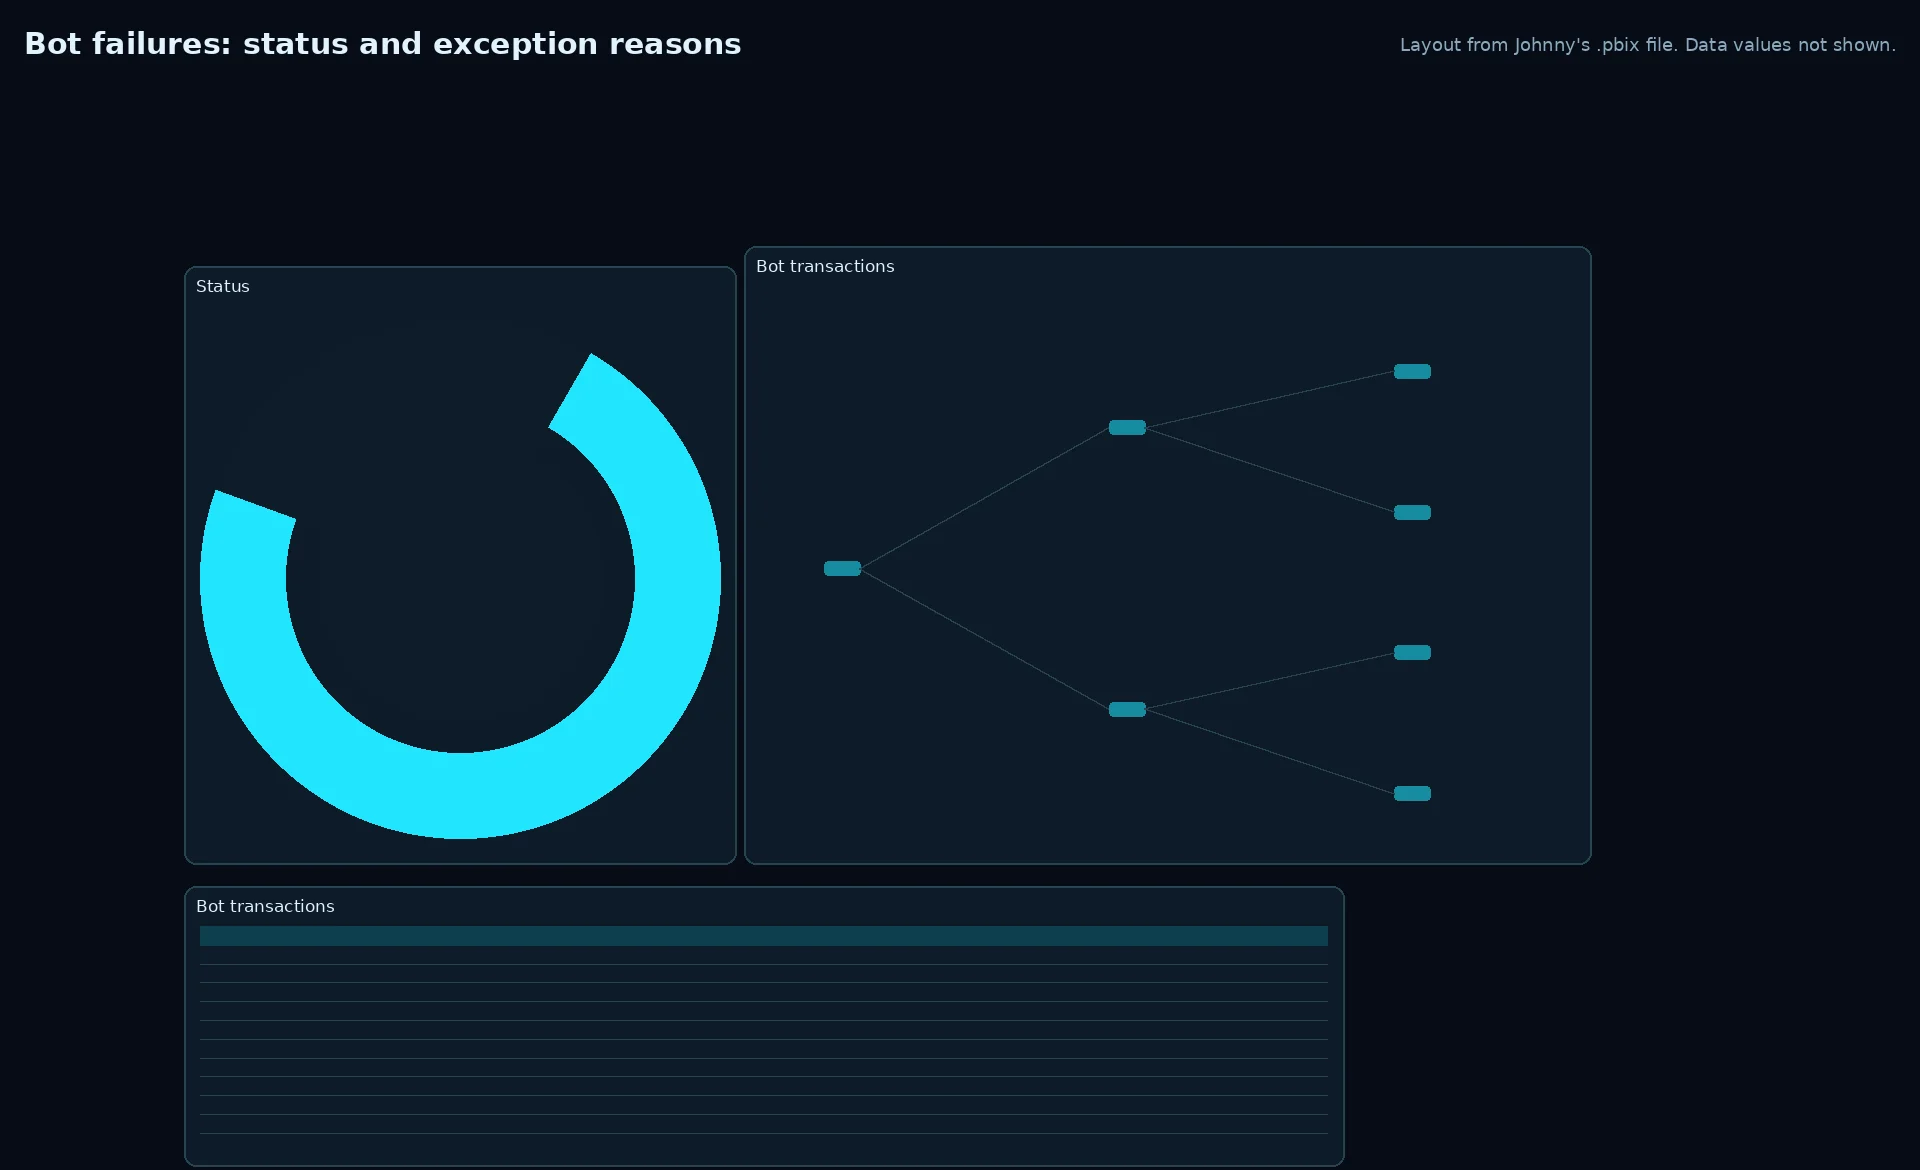
Failure reasons
Drill from status to exception reason to see why bots fail.
Tech stack in this project
- Power BIData model, DAX measures (ROI, payback, averages), dashboards, tooltips with formulas
- UiPathBot run logs: status, exception and execution time
- Microsoft ExcelProject register with costs, savings and owners
Why it matters for supply chain
- ROI and payback = business cases for WMS, TMS and automation investments
- Exception analysis = root cause of order and shipment failures
- Before vs after time = continuous improvement in warehouse and transport ops
Linked to my Master of Logistics & SCM, University of Sydney
Gallery
Read the full case study
Problem
The UNSW CFO and finance managers needed to see which automation projects were profitable, how the automated workflows were performing and why some bot runs failed.
Approach
- Designed and built a Continuous Improvement Dashboard in Power BI to assess each project over time, with ROI analysis and payback period calculations to identify profitable initiatives, and presented the findings to the CFO.
- Redesigned the existing automation dashboard so the CFO and finance managers could read current automation performance: transactions per workflow and month, estimated time saved, and UiPath bot success and failure.
- Analysed bot success rates and drilled into exception reasons to investigate failures.
- Layout images marked as layouts are drawn from Johnny's own .pbix files with data values hidden.
Figures are the confirmed dashboard figures or Johnny's own estimates, labelled as such.