
All projects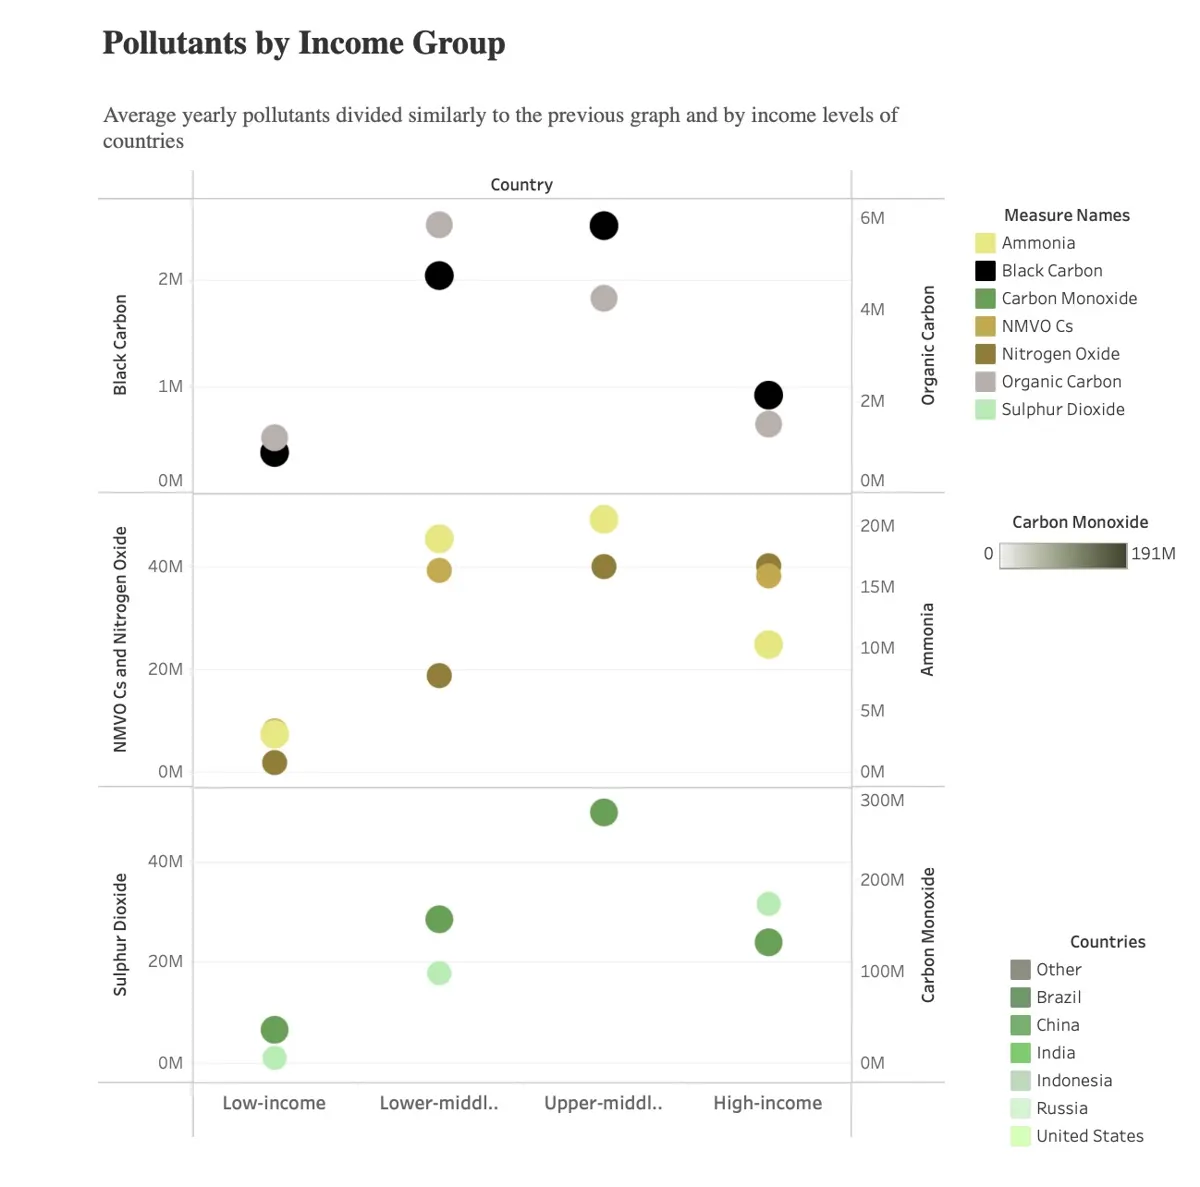
Animated overview of the steps below (an illustration, not recorded footage).
DataSoc x NAB Datathon 2023
Second Runner-up with a Tableau-backed sustainability strategy
- Tableau
From datasets to the final pitch
01Step 1 of 4
Datasets
Air pollution, land use and water and waste data.
02Step 2 of 4
Cleaning
Cleaned and prepared the datasets for analysis.
03Step 3 of 4, Tableau
Tableau dashboards
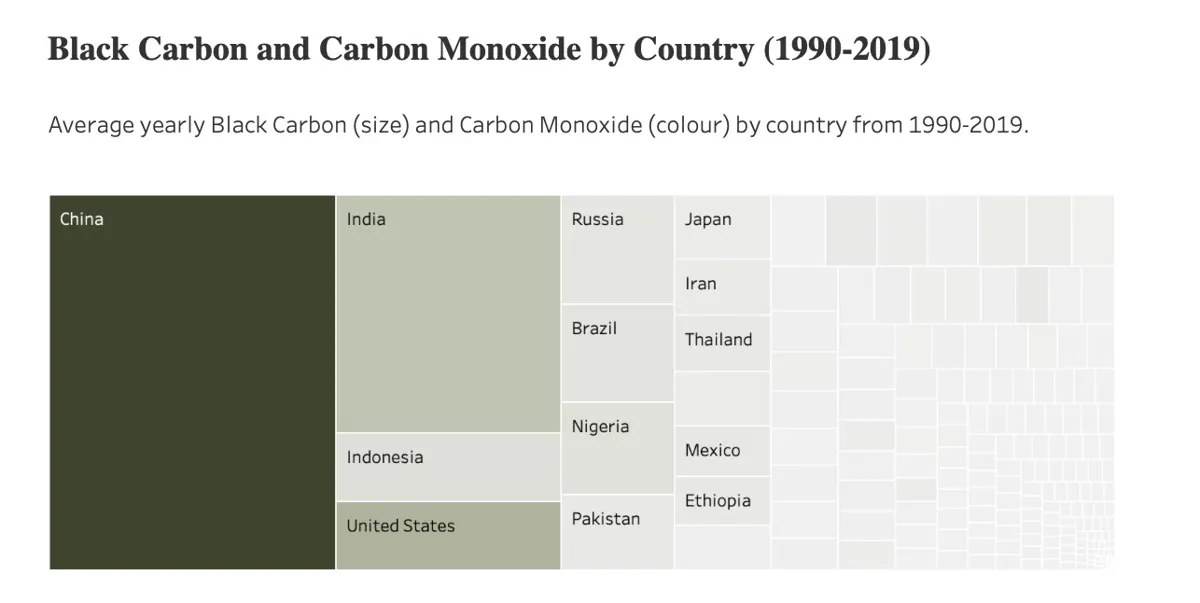
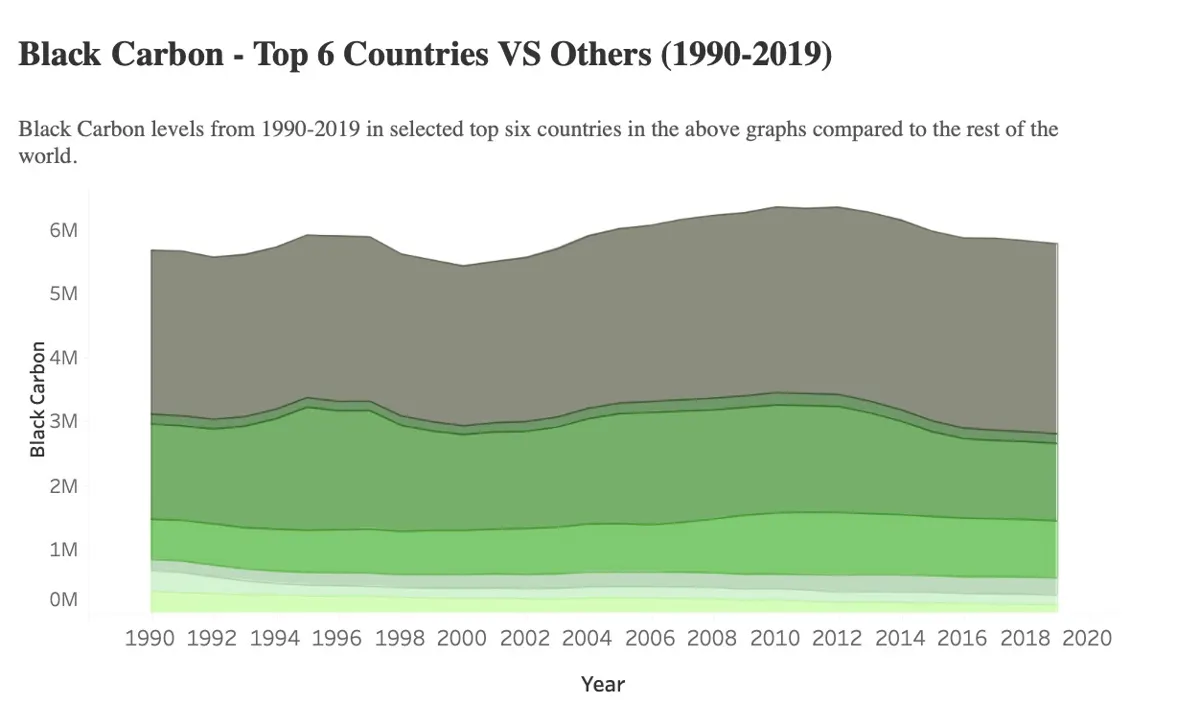
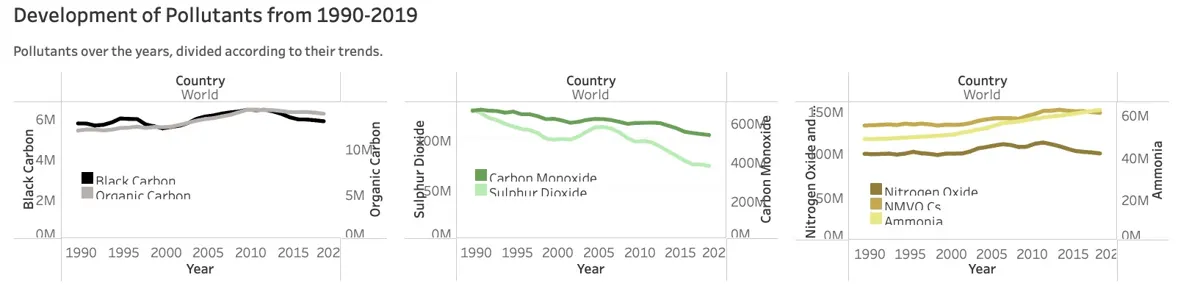
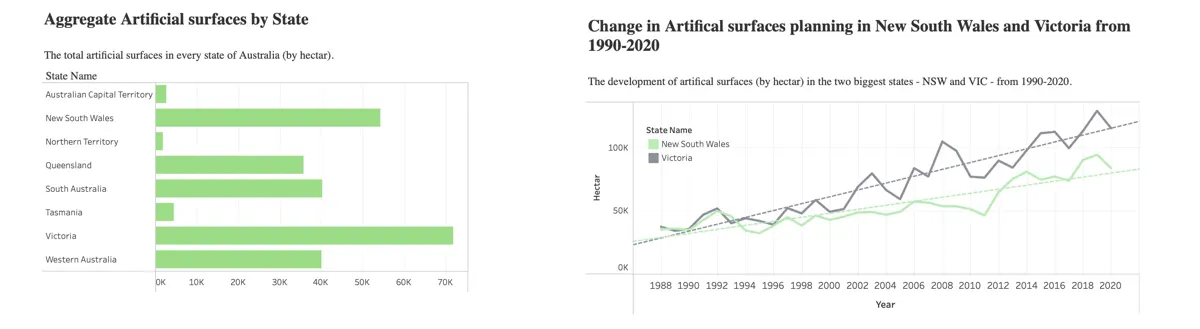
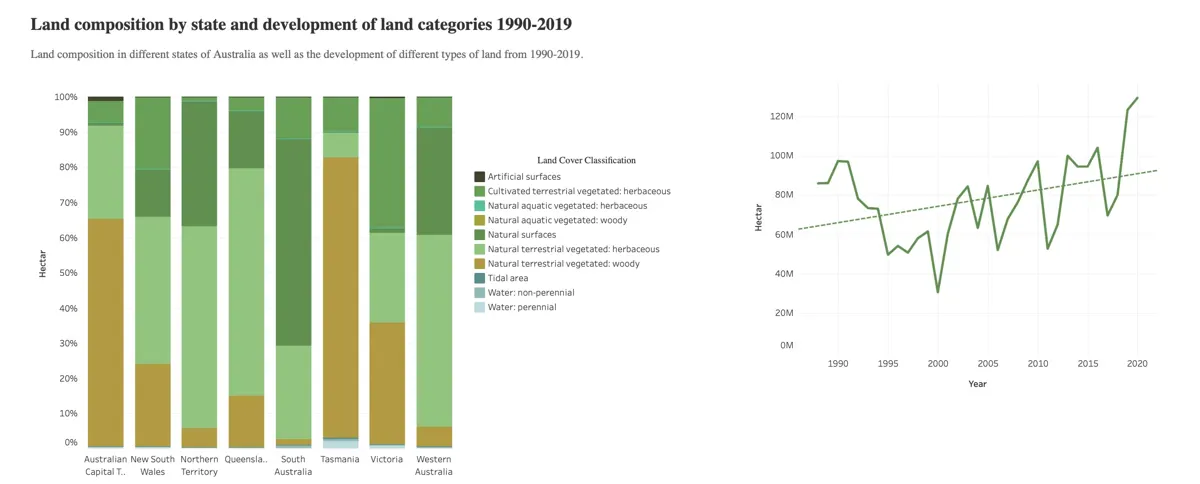
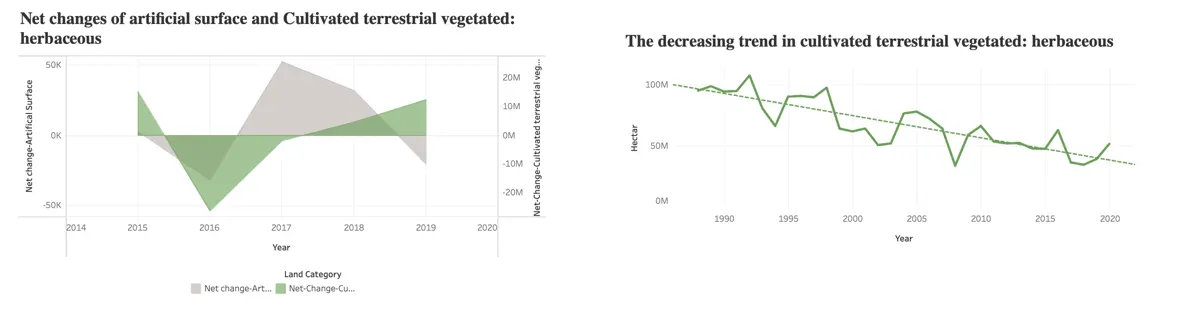
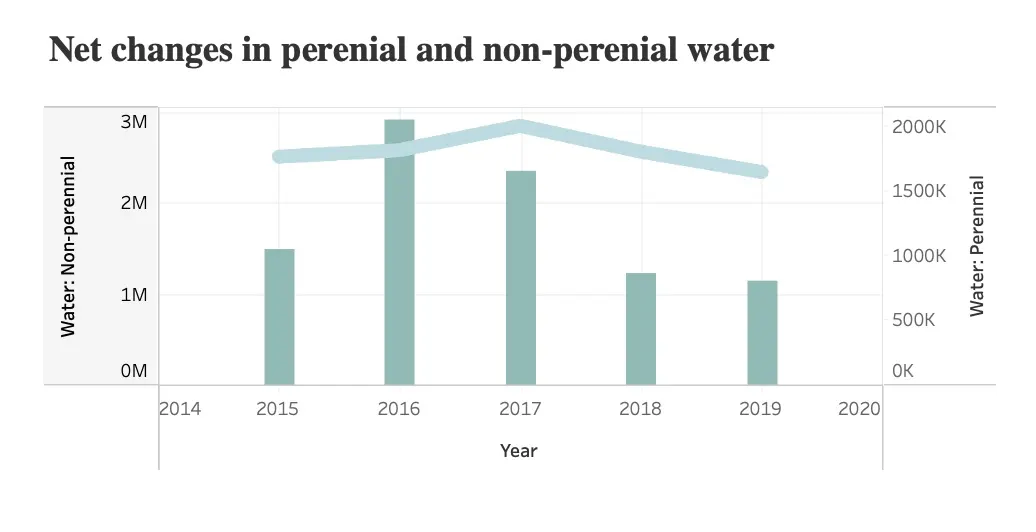
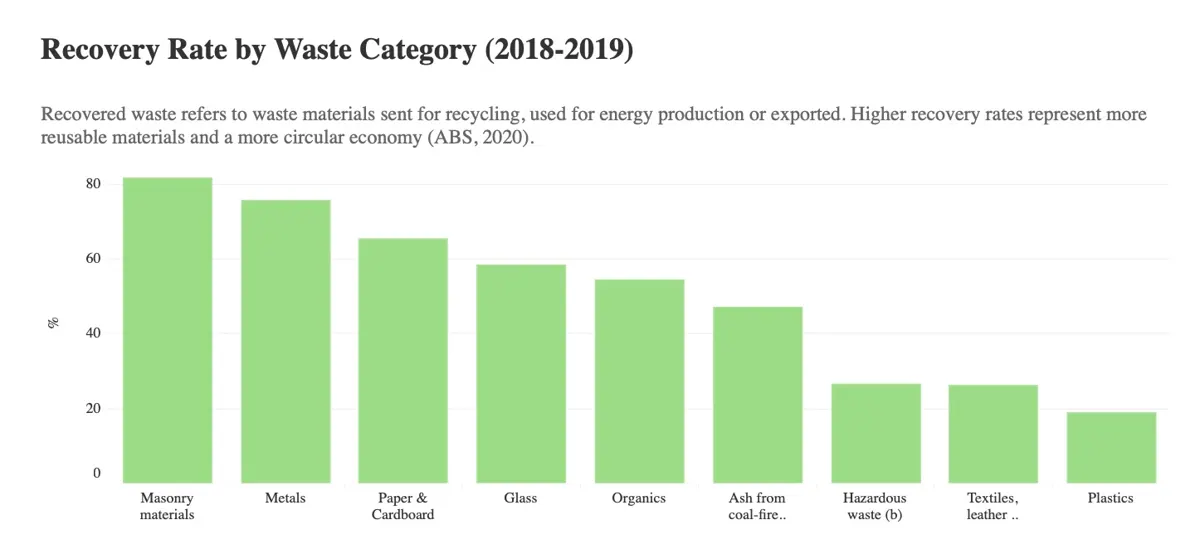
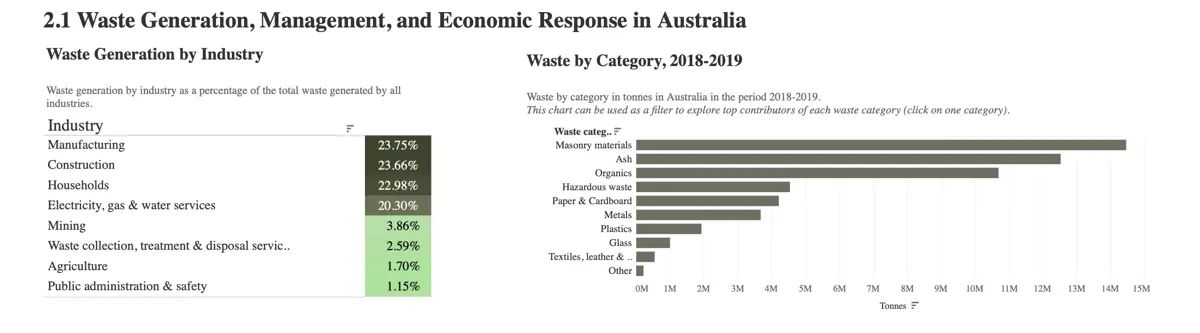
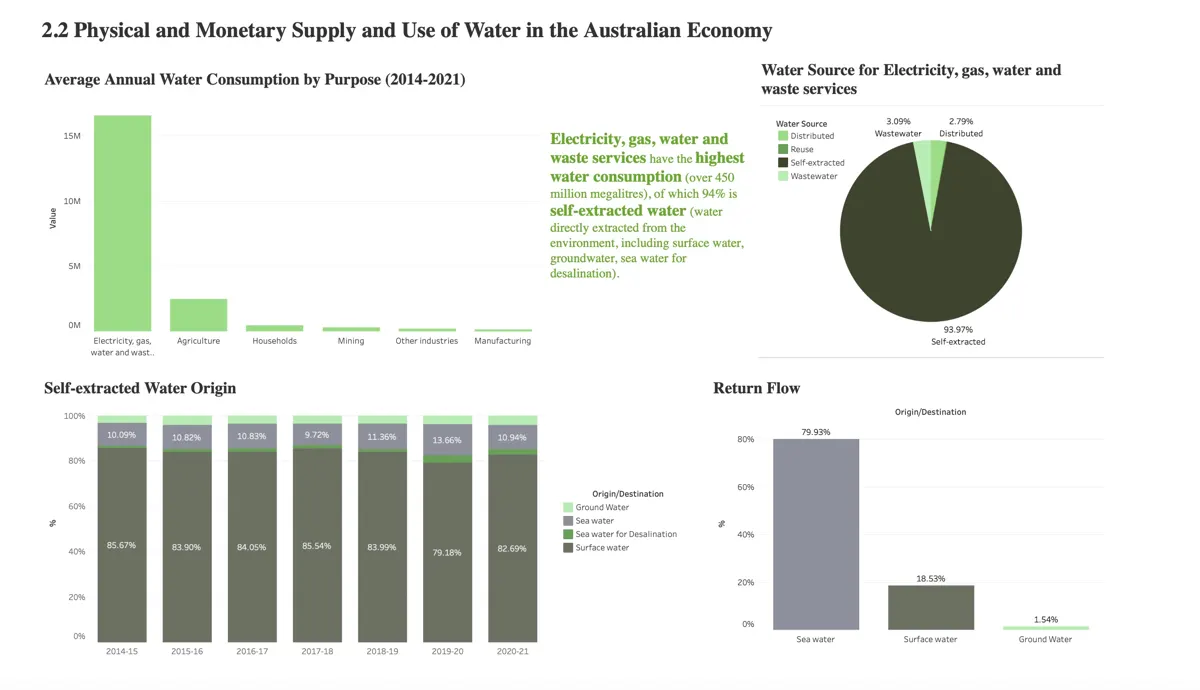
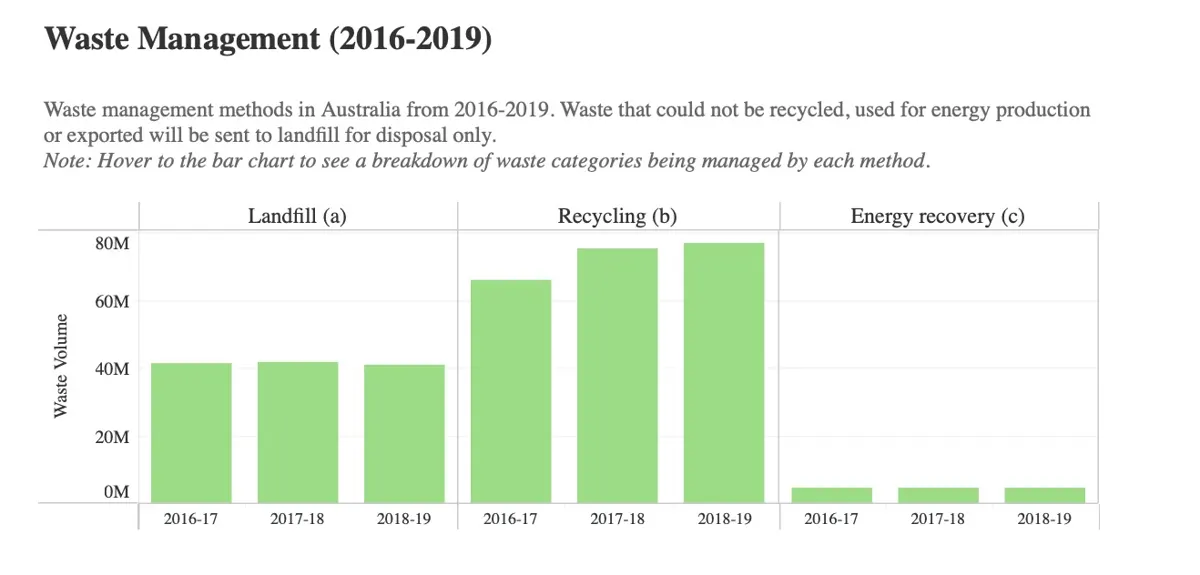
Charts and dashboards to explore the data and back the strategy.
04Step 4 of 4
Strategy pitch
Pitched a sustainability strategy in the final round.
Tech stack in this project
- TableauEvery chart and dashboard in the analysis
Why it matters for supply chain
- Waste data = reverse logistics and circular supply chains
- Emissions view = sustainable sourcing and network choices
- Dashboards = KPI visibility for supply chain decisions
Linked to my Master of Logistics & SCM, University of Sydney
Gallery
Read the full case study
Problem
Use air pollution, land use and water and waste data to propose sustainability strategies, and present them in the final round.
Approach
- Analysed air pollution, land use and water and waste datasets.
- Built Tableau dashboards and charts to explore the data and support the recommendations.
- Pitched a sustainability strategy in the final round; the team placed Second Runner-up.